
Is your organization fully leveraging the power of Oracle Exadata?
If you face challenges such as:
It's a clear sign you need a purpose-built tool for your Exadata platform.
GoMon4Exa is designed for organizations that require a comprehensive, independent, and flexible monitoring solution — covering everything from infrastructure to the database layer.
GoMon4Exa is Goldenore’s proprietary monitoring solution, purpose-built for Oracle Exadata environments.It combines Goldenore’s extensive experience in implementing this platform with the need to provide complete visibility and control over its key components — databases, hardware resources, and system workload. Designed with performance, scalability, and flexibility in mind, GoMon4Exa overcomes the limitations of traditional monitoring tools. It delivers deep insight into Exadata operations, simplifies trend analysis, and enables proactive issue detection before they affect system performance. GoMon4Exa addresses the needs of organizations seeking a comprehensive, independent, and open solution for managing the entire Oracle Exadata platform.
Uncover bottlenecks instantly and keep Exadatarunning at peak performance.
Predict growth and plan resources beforeutilization becomes a problem.
Identify workload interactions across databases and ensure balanced, efficient performance.
Detect anomalies early and prevent unplanned downtime with smart alerts.
Monitor key performance indicators to uphold and verify service-levelcommitments.
Gain full-stack visibility without extra agents or licenses — reduce cost, not insight.
With over a decade of Exadata implementations across industries, Goldenore knows the platform inside and out. GoMon4Exa is a direct response to client needs and real-world challenges — purpose-built where generic tools fall short.
Ready to take control of your Exadata monitoring?Contact Goldenore today to request a demo or consultation.
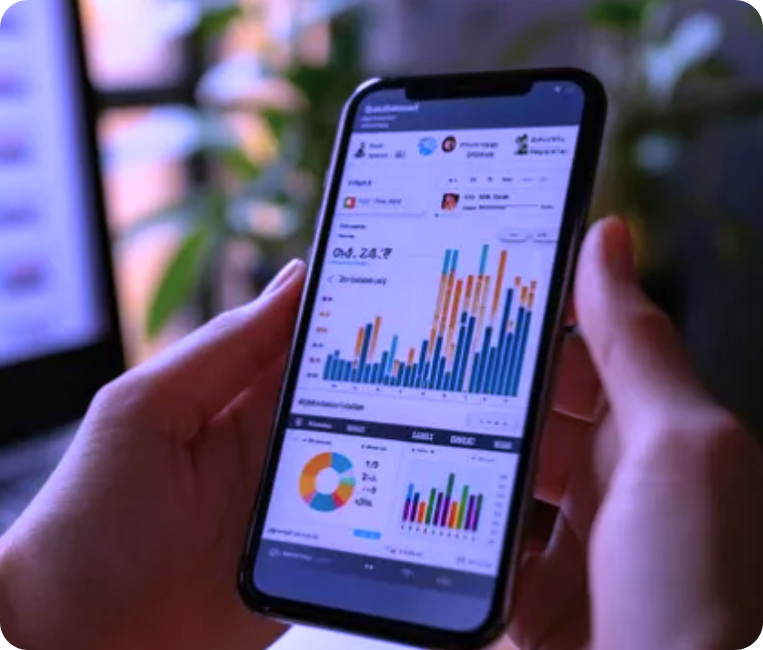
Dive into a world of complete control and transparency! Log in to the demo version and see how GoMon4Exa simplifies day-to-day Exadata monitoring by presenting data through intuitive and interactive dashboards. See for yourself how our solution enables you to track key performance and health indicators, analyze server and database workloads, monitor Flash Cache usage and detailed I/O metrics, filter data by platform, cluster, or PDB, and combine insights from different layers of the environment in one place.
Test GoMon4Exa today and discover how to gain a full view of Exadata performance — from infrastructure to database.
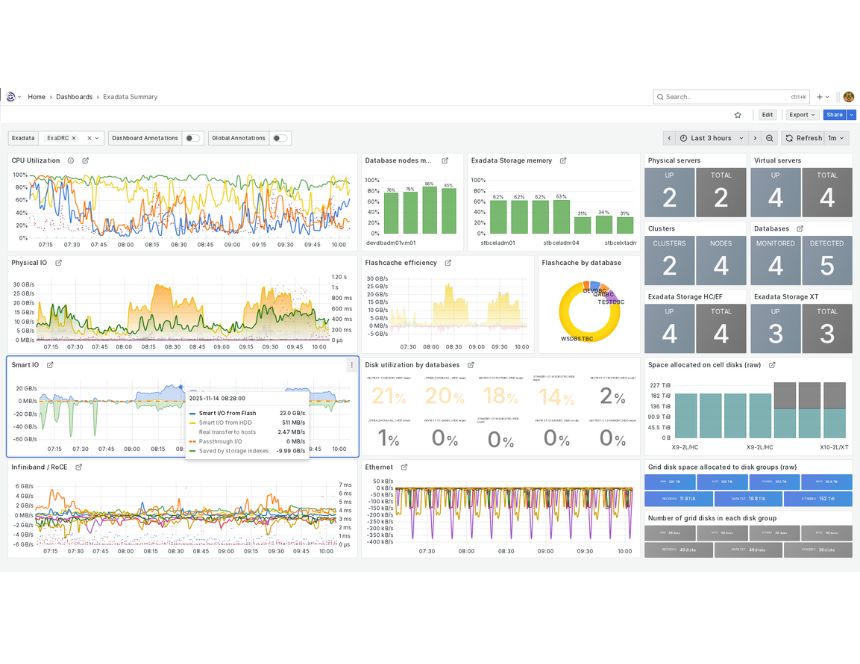
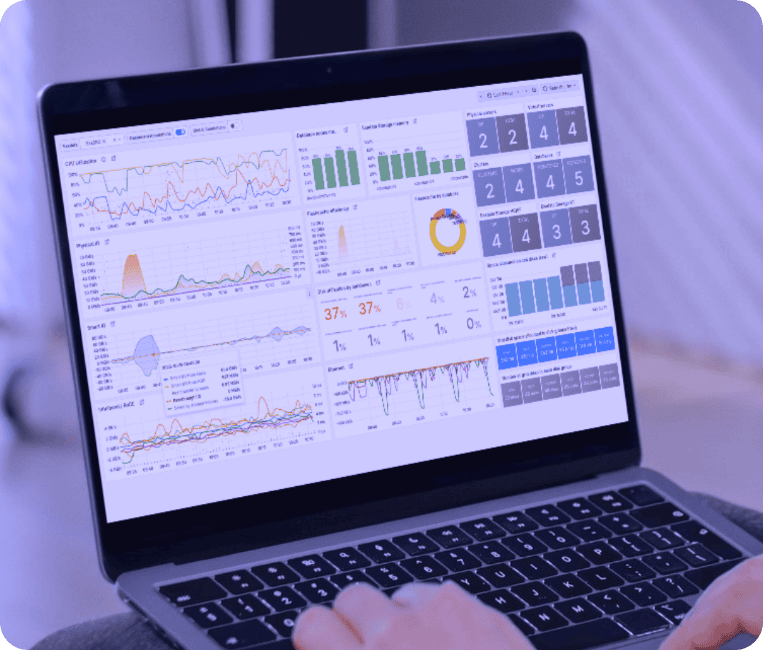
A high-level view of key metrics and the overall status of Oracle Exadata components, including current and historical CPU load, network and disk activity, Smart Scan offload operations, and top databases by storage workload. Each section includes a context menu for quick access to detailed drill-down charts.
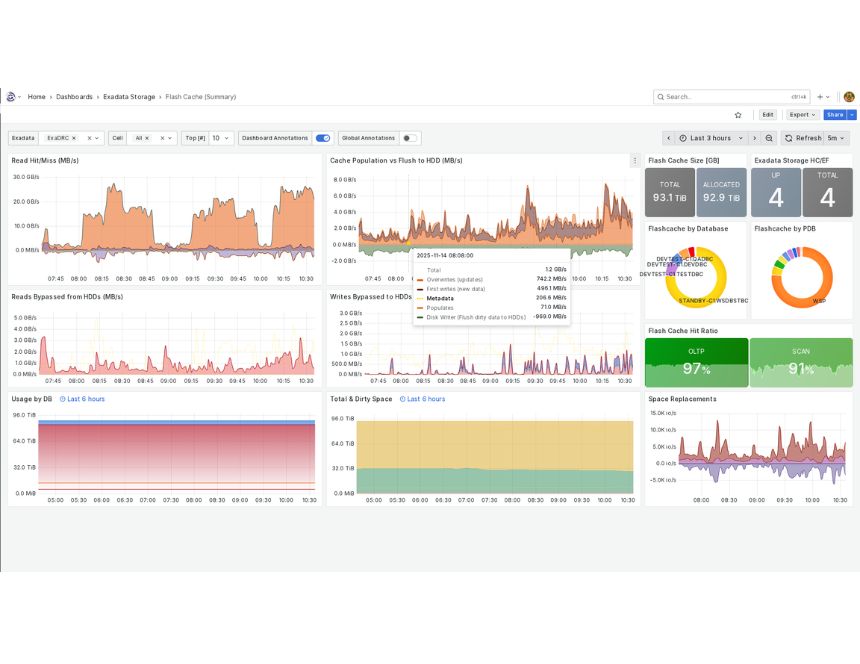
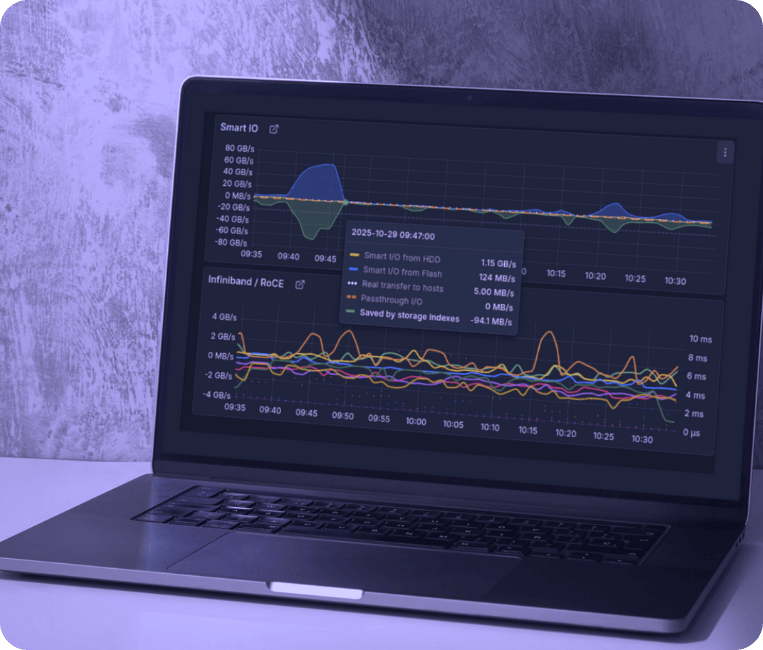
Shows how effectively reads use the high-speed NVMe Flash Cache (hit/miss), how quickly data is added or flushed, and how cache space is utilized over time by individual databases.
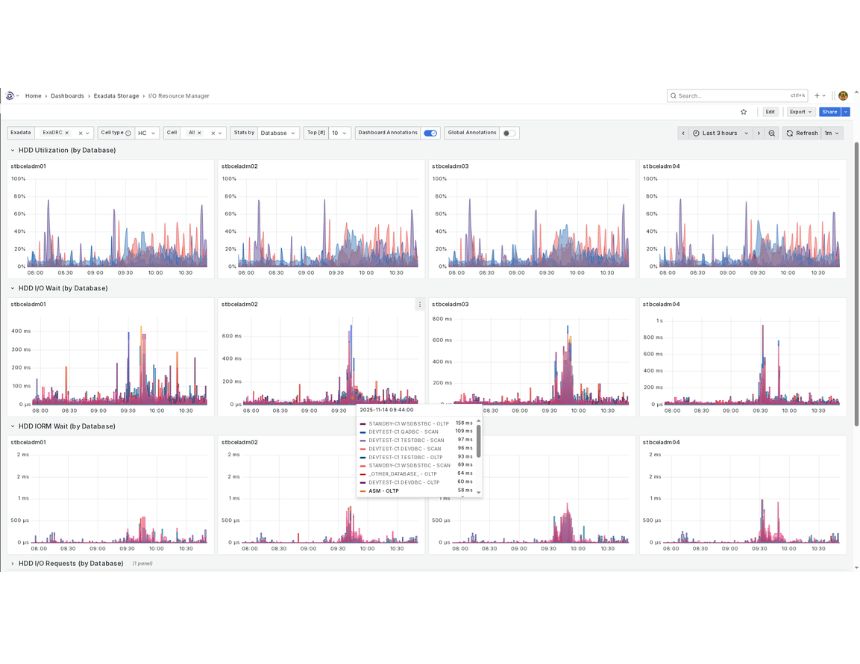
Displays how each database contributes to HDD and Flash usage and the latency it experiences before and after IORM policies are applied. The view can be broken down by pluggable databases or consumer groups and shows data per storage server, with server selection available via the top menu.
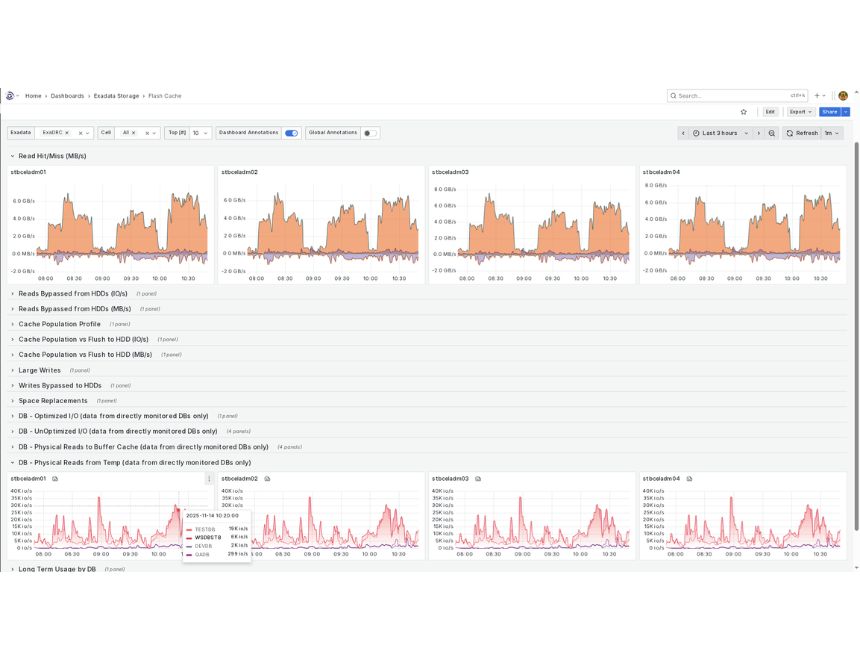
The system uses Exadata Management Servers (MS) for aggregated storage metrics and enhances them with direct database monitoring. This lets us break down key indicators by individual databases — for example, temporary tablespace reads, which can heavily impact HDD performance and slow analytical workloads.
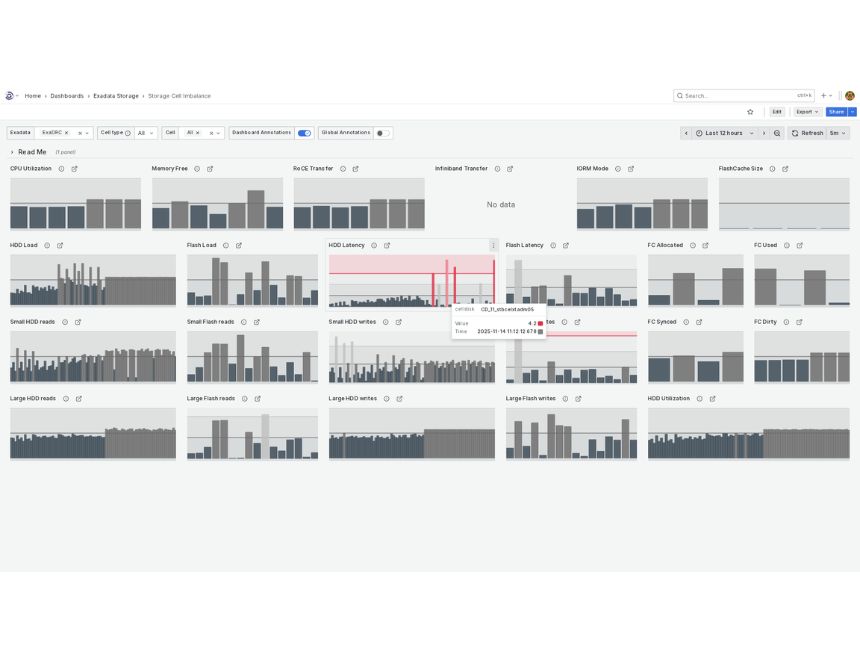
We identify imbalanced workloads and slow-responding drives by calculating Z-scores for key metrics. This quickly highlights cases where a single drive becomes a bottleneck and impacts overall system performance.
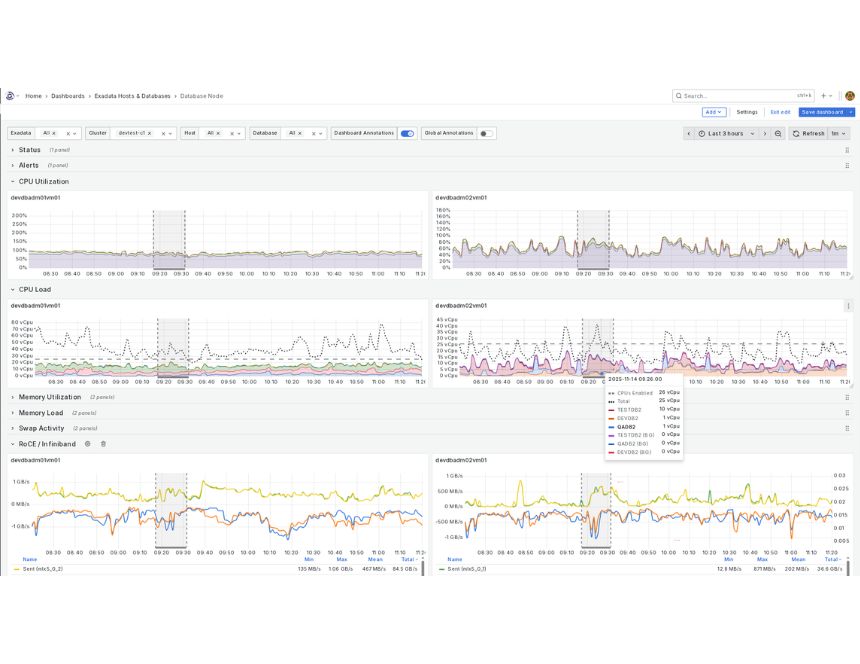
By comparing OS load with CPU usage reported by databases, we can spot gaps that may indicate unwanted processes consuming resources. Grafana’s built-in tools let you highlight and correlate time ranges across dashboards, making issue analysis faster and more precise.
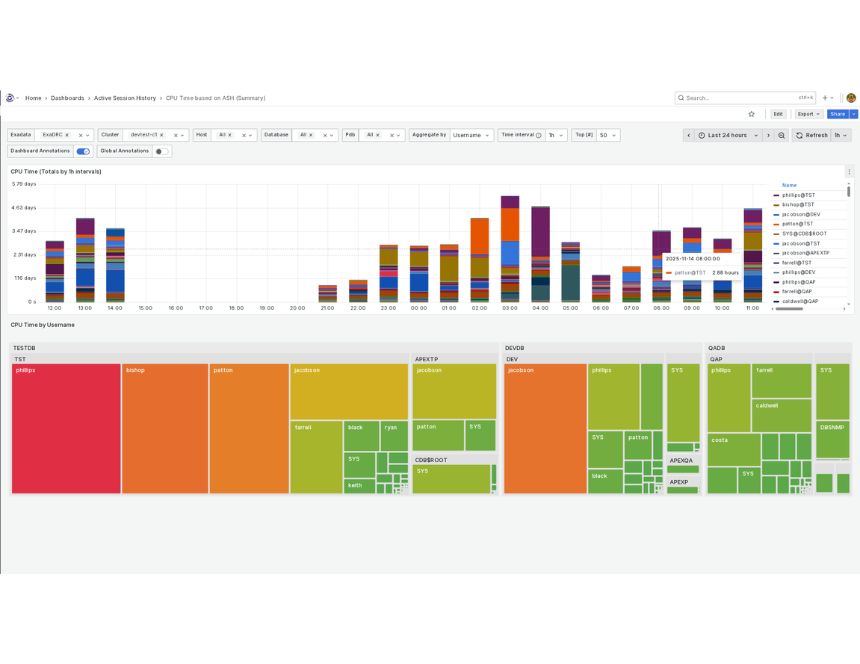
We use lightweight V$ views for direct monitoring without requiring the Diagnostics Pack, and can add custom SQL metrics—including ASH queries when needed. This lets us aggregate resource usage (e.g., CPU) by users, modules, or services. We can also collect this data from read-only Standby databases and retain it longer than the database itself.
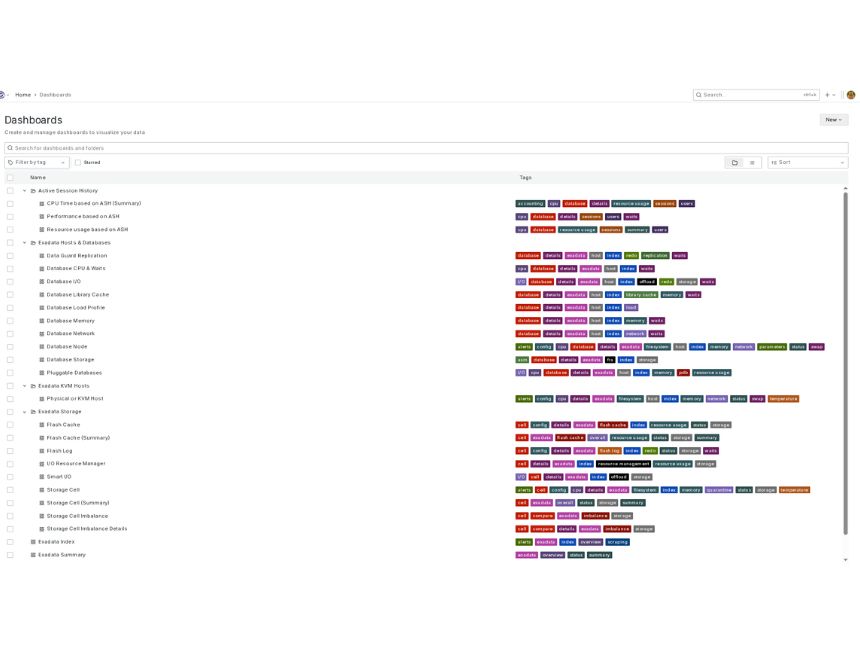
A wide range of ready-made dashboards is available, tagged and organized into folders for easy navigation—for example, “Exadata Storage” for storage metrics and “Exadata Hosts & Databases” for compute servers and their databases.
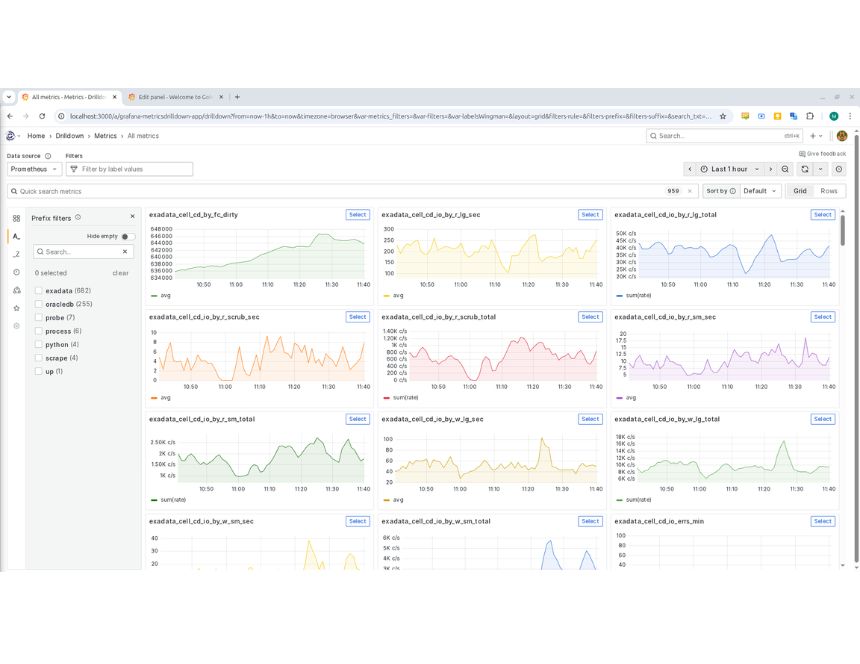
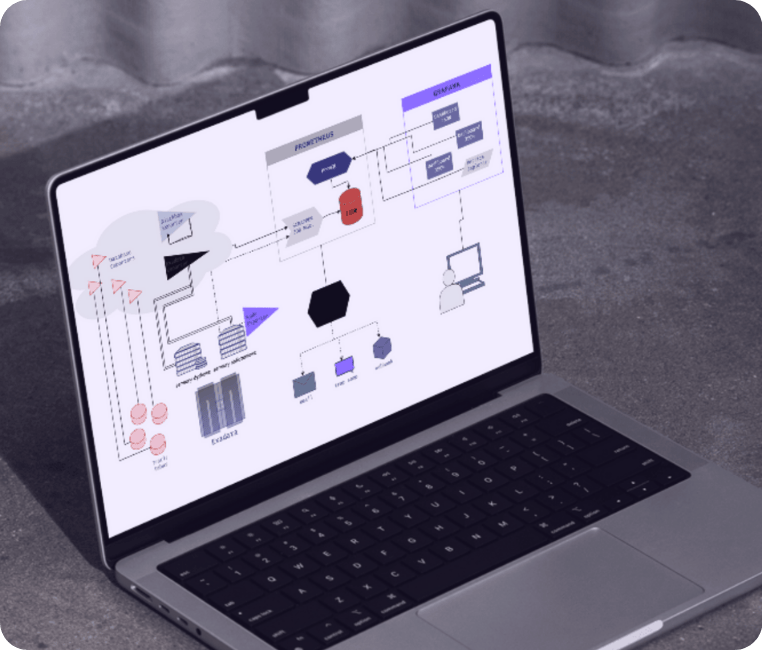
GoMon is built on Prometheus and Grafana—open, flexible technologies widely used in modern monitoring. Administrators can access all collected metrics (around 700 from Exadata servers and 250 from databases), build custom dashboards, and add new SQL-based metrics when needed. GoMon4Exa also integrates easily with other Prometheus-compatible systems, allowing metric exchange in both directions.
Oracle® and Exadata® are registered trademarks of Oracle Corporation.
